Posts Tagged: data visualisation
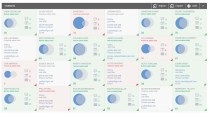
Romulus
A design task came my way last week for software start-up Romulus who have designed a sales management software tool. Their main business is flexible printed hospital screens but they have found that their network is interested in how to
Romulus
A design task came my way last week for software start-up Romulus who have designed a sales management software tool. Their main business is flexible printed hospital screens but they have found that their network is interested in how to
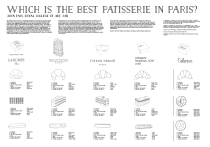
Best Patisserie in Paris
In Paris for a conference recently so alongside the more formal research I presented (related to social interaction design, and robotic displays but that’s a different post) I carried out some highly subjective research into Parisian patisseries. Five participants were
Best Patisserie in Paris
In Paris for a conference recently so alongside the more formal research I presented (related to social interaction design, and robotic displays but that’s a different post) I carried out some highly subjective research into Parisian patisseries. Five participants were
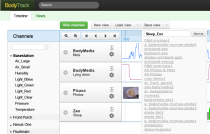
BodyTrack/Fluxtream
Just finished working on this application. BodyTrack is a CREATE Lab project from Carnegie Mellon University run by the brilliant Anne Wright and Fluxtream a start up run by Candide Kemmler. Both applications attempt to aggregate personal measurement
BodyTrack/Fluxtream
Just finished working on this application. BodyTrack is a CREATE Lab project from Carnegie Mellon University run by the brilliant Anne Wright and Fluxtream a start up run by Candide Kemmler. Both applications attempt to aggregate personal measurement

Inuit Genealogy
Currently working on a research project related to Canadian and Greenland Inuit with R0gMedia in Berlin. The diagram above is a genealogical diagram made in the mid 1950s by anthropologist Jean Malaurie, the first of its kind. It’s a hand
Inuit Genealogy
Currently working on a research project related to Canadian and Greenland Inuit with R0gMedia in Berlin. The diagram above is a genealogical diagram made in the mid 1950s by anthropologist Jean Malaurie, the first of its kind. It’s a hand

Behaviour scripts
How can airports reassure travellers and other airport users, while at the same time deter those with mal-intent? Airport security is often expressed in terms of theatre and performance, with emphasis on how to get people to behave in a
Behaviour scripts
How can airports reassure travellers and other airport users, while at the same time deter those with mal-intent? Airport security is often expressed in terms of theatre and performance, with emphasis on how to get people to behave in a

Drawings
I’ve been making these hand drawn wireframes that attempt to map out some ways of correlating different self reported healthcare metrics. Making these drawings raised some questions about how information is read and understood. How much does the layout and
Drawings
I’ve been making these hand drawn wireframes that attempt to map out some ways of correlating different self reported healthcare metrics. Making these drawings raised some questions about how information is read and understood. How much does the layout and
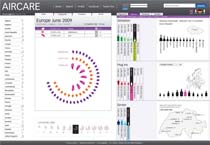
Aircare
First look at a market data visualisation tool. The graphic shows sales of Aircare products across the world by country, fragrance, year, month, category etc etc. Next phase to anticipate a comparison tool for all these variables. The aim is
Aircare
First look at a market data visualisation tool. The graphic shows sales of Aircare products across the world by country, fragrance, year, month, category etc etc. Next phase to anticipate a comparison tool for all these variables. The aim is

Mafiosi
First version of mafia connections map. Started with the list of names on the left so lots of research necessary to get to version on right. I think this shows some of the problems of information design, designers often pack
Mafiosi
First version of mafia connections map. Started with the list of names on the left so lots of research necessary to get to version on right. I think this shows some of the problems of information design, designers often pack
